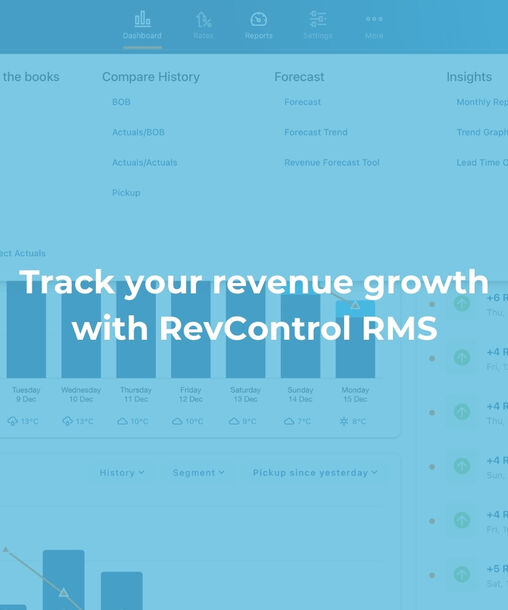
That’s exactly what RevControl’s reporting is for. You can measure results, spot trends, and support your pricing strategy with clear insights. And when it comes to truly tracking revenue growth, the Compare History reports are essential.
Measure your results with Compare History reports
The Compare History environment consists of four components. Together, they give you a complete view of performance, differences versus previous periods, and the underlying market demand.
1. Business on the Books (BOB)
With the Business on the Books report, you can see your current reservations on the books. You get instant insight into the most important KPIs, such as ADR and RevPAR. Perfect for quickly assessing how you’re performing on specific days, weeks, or months.
2. Actuals versus BOB
In this report, you compare historical figures with your current reservations on the books. This shows you exactly how you performed last year, what you already have on the books now, and what gap still needs to be filled. The nice part is that RevControl calculates this difference automatically, so you can see at a glance where the opportunities are and where you need to adjust.
3. Actuals versus Actuals
Prefer to compare hard numbers year over year? Then Actuals versus Actuals is the right choice. Here you compare realized results across different years, including the current year. Again, RevControl calculates the differences automatically. Days with lower results stand out immediately, and positive spikes are just as easy to spot. This helps you recognize patterns and steer more effectively.
4. Pickup report
Finally, there’s the Pickup report. This report compares the total of reservations and cancellations across two different periods. This shows how market demand has evolved, which segments that demand comes from, and what impact it has had on your KPIs. Useful if you want to understand why a certain period performed better or worse, and what market movements were behind it.
These four reports give you concrete tools to measure the positive impact of RevControl compared to a period without an RMS. Because differences are calculated automatically, you don’t need to puzzle things out in Excel yourself, and you can act faster based on the outcomes.
Not just looking back, but also forward: Revenue Forecast Tool
Want to make the future just as clear as the past? Then use RevControl’s Revenue Forecast Tool. This tool automatically calculates your expected room revenue based on factors such as expected ADR, Room Nights Sold, and your forecast. It then compares this directly with last year, with what’s currently on the books, and with your revenue targets. This way, you not only know where you’ve been, but also whether you’re on track.
RevControl is a comprehensive product with many reporting options. And because we offer different packages, there’s always a fit for the way you work and your revenue management needs. By using the Compare History reports and the Forecast tool, you’ll know exactly what your revenue growth is with RevControl, and where you can take the next step.
Do you have questions about these reports, or would you like to see them in action? Feel free to send us a chat or email, we’ll be happy to help.