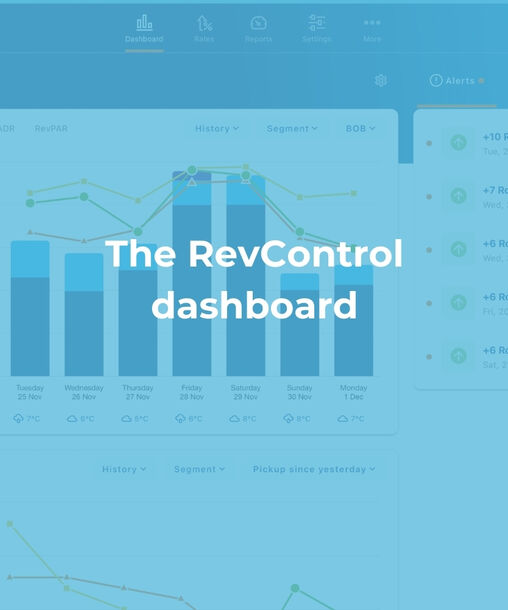
Business on the books
We start with the most important part: insight into the reservations you currently have on the books. In a clear widget you can instantly see how your property is performing. You can easily scroll through key figures such as occupancy, ADR and RevPAR for a week of your choice. We automatically compare this data to historical figures like last week, last month and last year at the same moment, or to the results that were ultimately achieved. This way you immediately see whether you are on track.
Pick up
Pick up is one of the most crucial indicators in revenue management. That is why RevControl has its own pick up widget. It shows you the changing market demand for a period you select. Opening your laptop on Monday? Choose the period of three days and instantly view the pick up made over the weekend for the coming week. We automatically compare this to the pick up of last week, last month and last year. Within seconds you gain clear insight into the demand in the market.
Our system goes further than simply displaying numbers. Alerts notify you when the demand for a specific future date is noticeably high or low. These messages appear in the top right corner of the dashboard so you don’t have to manually search through the entire year to find trends.
Actuals
In addition to future reservations you also want to understand your actual performance. These figures are called the actuals. They reflect past results that can no longer change and therefore form a reliable basis for analysis. Easily review the achieved performance per key indicator. By clicking on the graph you can see exactly which segments the revenue comes from and which figures correspond to them.
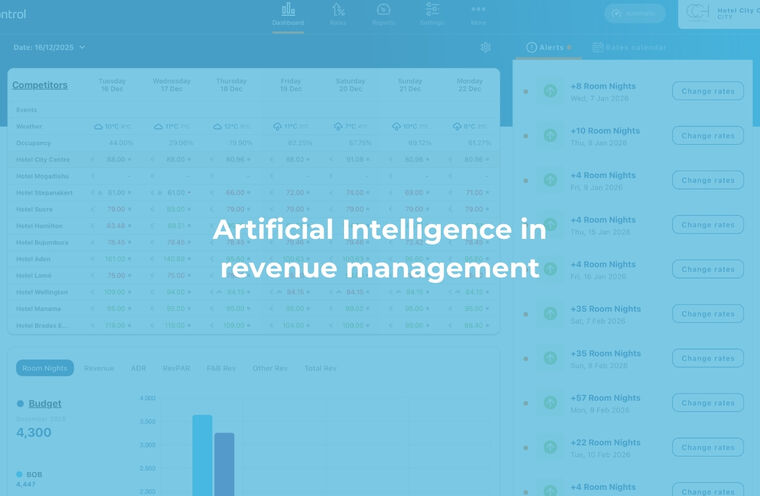
Competitors
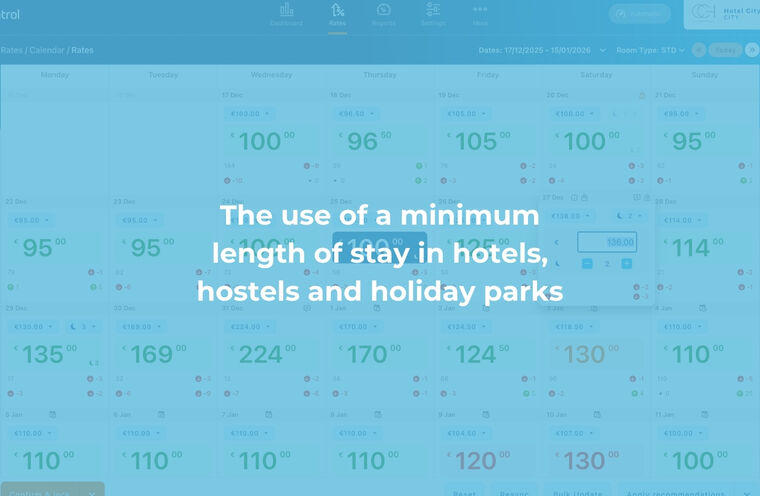
Besides your own data market information is essential. In the competitors section you can compare your prices with those of your competitors in a clear table. Small icons show you at a glance whether competitors include breakfast or use a minimum length of stay. By hovering over the prices you can see extra details such as recent increases or decreases. All this information is automatically included in our pricing calculations but having insight into the market yourself remains important.
Budget
Finally there is the budget widget. In RevControl you can easily set your goals per indicator and per segment. These goals are shown on the dashboard and in the rates calendar. This way you immediately see whether market demand aligns with your expected results and whether adjustments are needed.
Detailed intuitive and fully transparent. That is how we describe our dashboard. Want to experience it yourself? Send us a chat or an email and start working with RevControl today.